Анализ и визуализация временных рядов в Python
Модуль datetime предоставляет классы для обработки времени и даты разными способами.
import datetime
Классы, предоставляемые модулем datetime:
- Класс
datetime.date(year, month, day)- стандартная дата. Атрибуты: year, month, day. Неизменяемый объект. - Класс
datetime.time(hour=0, minute=0, second=0, microsecond=0, tzinfo=None)- стандартное время, не зависит от даты. - Класс
datetime.timedelta- разница между двумя моментами времени, с точностью до микросекунд. - Класс
datetime.tzinfo- абстрактный базовый класс для информации о временной зоне (например, для учета часового пояса и / или летнего времени). - Класс
datetime.datetime(year, month, day, hour=0, minute=0, second=0, microsecond=0, tzinfo=None)- комбинация даты и времени.
Методы класса datetime
datetime.today()- объект datetime из текущей даты и времени. Работает также, как и datetime.now() со значением tz=None.datetime.combine(date, time)- объект datetime из комбинации объектов date и time.datetime.strptime(date_string, format)- преобразует строку в datetime (так же, как и функция strptime из модуля time).datetime.strftime(format)- см. функцию strftime из модуля time.datetime.date()- объект даты (с отсечением времени).datetime.time()- объект времени (с отсечением даты).datetime.replace([year[, month[, day[, hour[, minute[, second[, microsecond[, tzinfo]]]]]]]])- возвращает новый объект datetime с изменёнными атрибутами.datetime.weekday()- день недели в виде числа, понедельник - 0, воскресенье - 6.
datetime.datetime(2017, 10, 5).year
today = datetime.datetime.today()
today
print('ctime:', today.ctime())
print('tuple:', today.timetuple())
print('ordinal:', today.toordinal()) # Return proleptic Gregorian ordinal.  January 1 of year 1 is day 1.
print('Year:', today.year)
print('Mon :', today.month)
print('Day :', today.day)
tuple: time.struct_time(tm_year=2019, tm_mon=2, tm_mday=27, tm_hour=0, tm_min=55, tm_sec=27, tm_wday=2, tm_yday=58, tm_isdst=-1)
ordinal: 737117
Year: 2019
Mon : 2
Day : 27
Ещё есть тип timedelta
today.replace(today.year + 1)
a = datetime.datetime(2010, 12, 5)
b = datetime.datetime(2010, 12, 7)
d = b - a
d.days
today + datetime.timedelta(days=1000)
В пандас (и numpy) также существует специальные типы данных для работы с временными данными: datetime64 и timedelta64.
import pandas as pd
import numpy as np
from datetime import datetime, time
import matplotlib.pylab as plt
import seaborn as sns
%matplotlib inline
from matplotlib.pylab import rcParams
pd.date_range('1/1/2000', periods=10, freq="D")
'2000-01-05', '2000-01-06', '2000-01-07', '2000-01-08',
'2000-01-09', '2000-01-10'],
dtype='datetime64[ns]', freq='D')
Обозначения, используемые для задания частоты
| Alias | Description |
|---|---|
| B | business day frequency |
| C | custom business day frequency (experimental) |
| D | calendar day frequency |
| W | weekly frequency |
| M | month end frequency |
| SM | semi-month end frequency (15th and end of month) |
| BM | business month end frequency |
| CBM | custom business month end frequency |
| MS | month start frequency |
| SMS | semi-month start frequency (1st and 15th) |
| BMS | business month start frequency |
| CBMS | custom business month start frequency |
| Q | quarter end frequency |
| BQ | business quarter endfrequency |
| QS | quarter start frequency |
| BQS | business quarter start frequency |
| A | year end frequency |
| BA | business year end frequency |
| AS | year start frequency |
| BAS | business year start frequency |
| BH | business hour frequency |
| H | hourly frequency |
| T, min | minutely frequency |
| S | secondly frequency |
| L, ms | milliseconds |
| U, us | microseconds |
| N | nanoseconds |
Можно использовать вместе с числами для уточнения
pd.date_range('1/1/2000', periods=10, freq="3D")
'2000-01-13', '2000-01-16', '2000-01-19', '2000-01-22',
'2000-01-25', '2000-01-28'],
dtype='datetime64[ns]', freq='3D')
Временной ряд можно задавать и иным образом — указывая время начала и время окончания.
start = datetime(2011, 1, 1)
end = datetime(2012, 1, 1)
pd.date_range(start, end, freq="BM")
'2011-05-31', '2011-06-30', '2011-07-29', '2011-08-31',
'2011-09-30', '2011-10-31', '2011-11-30', '2011-12-30'],
dtype='datetime64[ns]', freq='BM')
Можно указывать только один конец:
pd.date_range(end=end, periods=20)
'2011-12-17', '2011-12-18', '2011-12-19', '2011-12-20',
'2011-12-21', '2011-12-22', '2011-12-23', '2011-12-24',
'2011-12-25', '2011-12-26', '2011-12-27', '2011-12-28',
'2011-12-29', '2011-12-30', '2011-12-31', '2012-01-01'],
dtype='datetime64[ns]', freq='D')
Или даже превращать числа в дату (в данном случае в день)
pd.to_datetime(
    [1, 2, 3, 0], unit='D', origin=datetime(2012, 5, 3))  # можно просто "2012, 5, 3"
Пандас понимает разные форматы задания дат
s = pd.Series(
    ['2000-01-01', 'Jul 31, 2009', '2010-01-10', '2000-01-04', '2000-01-05'])
s
1 Jul 31, 2009
2 2010-01-10
3 2000-01-04
4 2000-01-05
dtype: object
pd.to_datetime(s)
1 2009-07-31
2 2010-01-10
3 2000-01-04
4 2000-01-05
dtype: datetime64[ns]
Работа с датафреймами.
ts_df = pd.DataFrame(
    np.random.randn(10, 3),
    columns=['A', 'B', 'C'],
    index=pd.date_range('1/1/2000', periods=10))
ts_df.head()
| A | B | C | |
|---|---|---|---|
| 2000-01-01 | 0.180772 | 1.202387 | -1.937531 |
| 2000-01-02 | 0.955101 | 0.930135 | -1.251356 |
| 2000-01-03 | -1.162816 | 0.843237 | -3.061066 |
| 2000-01-04 | 0.616560 | -1.417411 | -0.964808 |
| 2000-01-05 | -1.478241 | 0.728027 | 0.666432 |
Это особенный датафрейм, проиндексированный, как DatetimeIndex
ts_df.index
'2000-01-05', '2000-01-06', '2000-01-07', '2000-01-08',
'2000-01-09', '2000-01-10'],
dtype='datetime64[ns]', freq='D')
К датафреймам, проиндексированным таким образом, можно обращаться через индекс
ts_df["2000-01":"2000-01-04":2]
| A | B | C | |
|---|---|---|---|
| 2000-01-01 | 0.180772 | 1.202387 | -1.937531 |
| 2000-01-03 | -1.162816 | 0.843237 | -3.061066 |
Можно изменять промежуток при помощи метода asfreq:
ts_df.asfreq("45Min").head()
| A | B | C | |
|---|---|---|---|
| 2000-01-01 00:00:00 | 0.180772 | 1.202387 | -1.937531 |
| 2000-01-01 00:45:00 | NaN | NaN | NaN |
| 2000-01-01 01:30:00 | NaN | NaN | NaN |
| 2000-01-01 02:15:00 | NaN | NaN | NaN |
| 2000-01-01 03:00:00 | NaN | NaN | NaN |
ts_df.asfreq("45Min", method="pad").head()
| A | B | C | |
|---|---|---|---|
| 2000-01-01 00:00:00 | 0.180772 | 1.202387 | -1.937531 |
| 2000-01-01 00:45:00 | 0.180772 | 1.202387 | -1.937531 |
| 2000-01-01 01:30:00 | 0.180772 | 1.202387 | -1.937531 |
| 2000-01-01 02:15:00 | 0.180772 | 1.202387 | -1.937531 |
| 2000-01-01 03:00:00 | 0.180772 | 1.202387 | -1.937531 |
Можно аггрегировать наблюдения по дням
ts_df.resample("3D").mean()
| A | B | C | |
|---|---|---|---|
| 2000-01-01 | -0.008981 | 0.991920 | -2.083318 |
| 2000-01-04 | -0.083320 | -0.433786 | 0.736896 |
| 2000-01-07 | -0.236956 | -0.115868 | 0.686600 |
| 2000-01-10 | 0.440161 | 0.302742 | -1.019689 |
А что если колонка с датами — не индекс?
ts_df.reset_index(inplace=True)
ts_df.rename(columns={"index": "date"}, inplace=True)
ts_df.head()
| date | A | B | C | |
|---|---|---|---|---|
| 0 | 2000-01-01 | 0.180772 | 1.202387 | -1.937531 |
| 1 | 2000-01-02 | 0.955101 | 0.930135 | -1.251356 |
| 2 | 2000-01-03 | -1.162816 | 0.843237 | -3.061066 |
| 3 | 2000-01-04 | 0.616560 | -1.417411 | -0.964808 |
| 4 | 2000-01-05 | -1.478241 | 0.728027 | 0.666432 |
Это можно сделать так:
ts_df[(ts_df["date"] > datetime(2000, 1, 4))]
| date | A | B | C | |
|---|---|---|---|---|
| 4 | 2000-01-05 | -1.478241 | 0.728027 | 0.666432 |
| 5 | 2000-01-06 | 0.611721 | -0.611974 | 2.509063 |
| 6 | 2000-01-07 | -0.833818 | 0.976332 | 1.765312 |
| 7 | 2000-01-08 | 0.095417 | -0.027399 | -0.324176 |
| 8 | 2000-01-09 | 0.027533 | -1.296538 | 0.618665 |
| 9 | 2000-01-10 | 0.440161 | 0.302742 | -1.019689 |
Или с использованием свойства dt колонки датами
ts_df[(ts_df["date"].dt.day > 3) & (ts_df["date"].dt.day < 6)]
| date | A | B | C | |
|---|---|---|---|---|
| 3 | 2000-01-04 | 0.616560 | -1.417411 | -0.964808 |
| 4 | 2000-01-05 | -1.478241 | 0.728027 | 0.666432 |
| Property | Description |
|---|---|
| year | The year of the datetime |
| month | The month of the datetime |
| day | The days of the datetime |
| hour | The hour of the datetime |
| minute | The minutes of the datetime |
| second | The seconds of the datetime |
| microsecond | The microseconds of the datetime |
| nanosecond | The nanoseconds of the datetime |
| date | Returns datetime.date (does not contain timezone information) |
| time | Returns datetime.time (does not contain timezone information) |
| dayofyear | The ordinal day of year |
| weekofyear | The week ordinal of the year |
| week | The week ordinal of the year |
| dayofweek | The number of the day of the week with Monday=0, Sunday=6 |
| weekday | The number of the day of the week with Monday=0, Sunday=6 |
| weekday_name | The name of the day in a week (ex: Friday) |
| quarter | Quarter of the date: Jan-Mar = 1, Apr-Jun = 2, etc. |
| days_in_month | The number of days in the month of the datetime |
| is_month_start | Logical indicating if first day of month (defined by frequency) |
| is_month_end | Logical indicating if last day of month (defined by frequency) |
| is_quarter_start | Logical indicating if first day of quarter (defined by frequency) |
| is_quarter_end | Logical indicating if last day of quarter (defined by frequency) |
| is_year_start | Logical indicating if first day of year (defined by frequency) |
| is_year_end | Logical indicating if last day of year (defined by frequency) |
| is_leap_year | Logical indicating if the date belongs to a leap year |
Самостоятельная работа
Набор данных про преступления.
-
Создайте новую колонку, где будет храниться время и дата совершения преступления в подходящем формате.
В наборе данных время закодировано в формате military time. Для выполнения первого пункта задания Вам необходимо перекодировать время по следующей схеме:
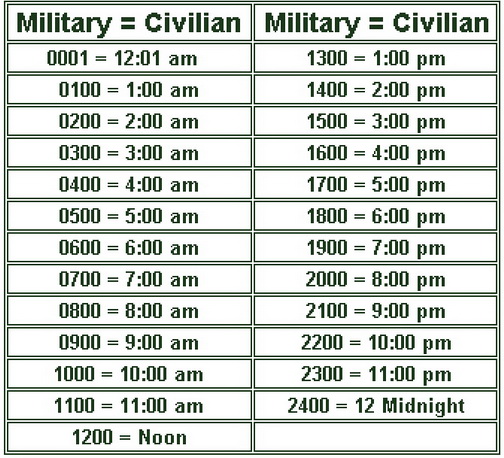
-
В какое время суток уровень преступности наивысший. С чем это может быть связано?
-
В какой день недели происходит наибольшее количество преступлений. С чем это может быть связано?
-
Постройте график, показывающий распределение количества преступлений в каждый из дней недели. Видите ли Вы различия во времени совершения преступлений в каждый из дней?
-
Постройте графики распределения количества преступлений по времени суток для мужчин и женщин. Различаются ли эти два распределения? Если да, то каким образом?
-
Какие виды преступлений чаще совершаются днём, а какие ночью? Почему?
-
Рассчитайте среднее количество преступлений в каждый из дней. Визуализируйте эту величину и опишите график.
-
Сколько дней в среднем проходит с момента совершения преступления до момента поступления информации о его совершении?
crimes = pd.read_csv("https://nagornyy.me/datasets/la-crimes/la-crimes-sample.csv",
                     parse_dates=["Date Reported", "Date Occurred"])
(crimes["Date Reported"].values[100] - crimes["Date Occurred"].values[100])
t1 = crimes["Date Reported"]
t2 = crimes["Date Occurred"]
print(t1.dtype, t2.dtype)
(t2 - t1).astype('timedelta64[m]')
1 0.0
2 0.0
3 0.0
4 0.0
5 -1440.0
6 0.0
7 -1440.0
8 0.0
9 0.0
10 0.0
11 -1440.0
12 -2880.0
13 0.0
14 -7200.0
15 0.0
16 0.0
17 0.0
18 0.0
19 0.0
20 -57600.0
21 0.0
22 0.0
23 -24480.0
24 -12960.0
25 -1440.0
26 0.0
27 -1440.0
28 0.0
29 0.0
...
4970 -1440.0
4971 -27360.0
4972 0.0
4973 -531360.0
4974 -7200.0
4975 0.0
4976 -1440.0
4977 -2880.0
4978 -1440.0
4979 -4320.0
4980 -1440.0
4981 -1440.0
4982 -1440.0
4983 0.0
4984 -1440.0
4985 -4320.0
4986 -1440.0
4987 -4320.0
4988 0.0
4989 -41760.0
4990 0.0
4991 -1440.0
4992 0.0
4993 -48960.0
4994 0.0
4995 0.0
4996 -1440.0
4997 0.0
4998 0.0
4999 0.0
Length: 5000, dtype: float64
from datetime import time


def parse_military_time(mtime):
    minutes = int(str(mtime)[-2:])
    hours = str(mtime)[:-2]
    hours = int(hours) if hours else 0
    return time(hours, minutes)
crimes["Time Occurred"] = crimes["Time Occurred"].apply(parse_military_time)
from datetime import timedelta
from datetime import datetime

# def merge_date_time(row):
#     date = row["Date Occurred"]
#     hour = row["Time Occurred"].hour
#     minute = row["Time Occurred"].minute
#     return date + timedelta(hours=hour, minutes=minute)


def merge_date_time(row):
    return datetime.combine(row["Date Occurred"], row["Time Occurred"])
crimes["DateTime Occurred"] = crimes.apply(merge_date_time, axis=1)
sns.violinplot(
    x=crimes["DateTime Occurred"].dt.weekday_name,
    y=crimes["DateTime Occurred"].dt.hour,
    palette='rainbow')

plt.ylim(0, 23)

crimes["DateTime Occurred"].dt.hour.plot(kind="kde")
plt.xlim(0, 23)

sns.distplot(crimes["DateTime Occurred"].dt.hour, hist=False)
plt.xlim(0, 23)

sns.distplot(crimes[crimes["DateTime Occurred"].dt.weekday_name == "Wednesday"]["DateTime Occurred"].dt.hour, hist=False)

plt.xlim(0, 23)

plt.subplots(figsize=(12, 4), dpi=200)

for wday in crimes["DateTime Occurred"].dt.weekday_name.unique():
    ax = sns.distplot(
        crimes[crimes["DateTime Occurred"].dt.weekday_name == wday][
            "DateTime Occurred"].dt.hour,
        hist=False,
        label=wday)
    ax.legend()
plt.xlim(0, 23)

plt.subplots(figsize=(12, 4), dpi=200)
crimes.resample("3M", on="DateTime Occurred").size()[1:-1].plot()

mask = (crimes["DateTime Occurred"] >= "2013-1") & (crimes["DateTime Occurred"] < "2013-1-3")
# опасно "2013-1-3" означает 2013 год, 3 января, 0:00:00 времени, а вовсе не весь этот день
crimes[mask]
| DR Number | Date Reported | Date Occurred | Time Occurred | Area ID | Area Name | Reporting District | Crime Code | Crime Code Description | MO Codes | ... | Status Code | Status Description | Crime Code 1 | Crime Code 2 | Crime Code 3 | Crime Code 4 | Address | Cross Street | Location | DateTime Occurred | |
|---|---|---|---|---|---|---|---|---|---|---|---|---|---|---|---|---|---|---|---|---|---|
| 1052 | 141904093 | 2014-01-02 | 2013-01-02 | 15:15:00 | 19 | Mission | 1954 | 510 | VEHICLE - STOLEN | NaN | ... | IC | Invest Cont | 510.0 | NaN | NaN | NaN | 10400 N SEPULVEDA BL | NaN | (34.2591, -118.4674) | 2013-01-02 15:15:00 |
| 1277 | 131504015 | 2013-01-01 | 2013-01-01 | 02:10:00 | 15 | N Hollywood | 1583 | 624 | BATTERY - SIMPLE ASSAULT | 0400 | ... | IC | Invest Cont | 624.0 | NaN | NaN | NaN | VENTURA | RADFORD | (34.1436, -118.3929) | 2013-01-01 02:10:00 |
| 1672 | 131317446 | 2013-09-01 | 2013-01-01 | 08:00:00 | 13 | Newton | 1362 | 810 | SEX, UNLAWFUL | 1813 0533 1259 | ... | IC | Invest Cont | 810.0 | NaN | NaN | NaN | 400 E 48TH ST | NaN | (33.9998, -118.2696) | 2013-01-01 08:00:00 |
| 2068 | 130704044 | 2013-01-02 | 2013-01-01 | 16:20:00 | 7 | Wilshire | 764 | 901 | VIOLATION OF RESTRAINING ORDER | 1501 | ... | AO | Adult Other | 901.0 | NaN | NaN | NaN | 1500 HAUSER BL | NaN | (34.0472, -118.3574) | 2013-01-01 16:20:00 |
| 2145 | 132104178 | 2013-01-04 | 2013-01-02 | 20:00:00 | 21 | Topanga | 2158 | 341 | THEFT-GRAND ($950.01 & OVER)EXCPT,GUNS,FOWL,LI... | 0344 | ... | IC | Invest Cont | 341.0 | NaN | NaN | NaN | 6300 DE SOTO AV | NaN | (34.1847, -118.5888) | 2013-01-02 20:00:00 |
| 2884 | 131505259 | 2013-01-24 | 2013-01-01 | 08:00:00 | 15 | N Hollywood | 1521 | 956 | LETTERS, LEWD | 1501 | ... | AO | Adult Other | 956.0 | NaN | NaN | NaN | 13100 VANOWEN ST | NaN | (34.194, -118.4181) | 2013-01-01 08:00:00 |
6 rows × 27 columns
dt_index = crimes.set_index("DateTime Occurred")
dt_index['2013-1':'2013-1-2']
| DR Number | Date Reported | Date Occurred | Time Occurred | Area ID | Area Name | Reporting District | Crime Code | Crime Code Description | MO Codes | ... | Weapon Description | Status Code | Status Description | Crime Code 1 | Crime Code 2 | Crime Code 3 | Crime Code 4 | Address | Cross Street | Location | |
|---|---|---|---|---|---|---|---|---|---|---|---|---|---|---|---|---|---|---|---|---|---|
| DateTime Occurred | |||||||||||||||||||||
| 2013-01-02 15:15:00 | 141904093 | 2014-01-02 | 2013-01-02 | 15:15:00 | 19 | Mission | 1954 | 510 | VEHICLE - STOLEN | NaN | ... | NaN | IC | Invest Cont | 510.0 | NaN | NaN | NaN | 10400 N SEPULVEDA BL | NaN | (34.2591, -118.4674) |
| 2013-01-01 02:10:00 | 131504015 | 2013-01-01 | 2013-01-01 | 02:10:00 | 15 | N Hollywood | 1583 | 624 | BATTERY - SIMPLE ASSAULT | 0400 | ... | STRONG-ARM (HANDS, FIST, FEET OR BODILY FORCE) | IC | Invest Cont | 624.0 | NaN | NaN | NaN | VENTURA | RADFORD | (34.1436, -118.3929) |
| 2013-01-01 08:00:00 | 131317446 | 2013-09-01 | 2013-01-01 | 08:00:00 | 13 | Newton | 1362 | 810 | SEX, UNLAWFUL | 1813 0533 1259 | ... | NaN | IC | Invest Cont | 810.0 | NaN | NaN | NaN | 400 E 48TH ST | NaN | (33.9998, -118.2696) |
| 2013-01-01 16:20:00 | 130704044 | 2013-01-02 | 2013-01-01 | 16:20:00 | 7 | Wilshire | 764 | 901 | VIOLATION OF RESTRAINING ORDER | 1501 | ... | NaN | AO | Adult Other | 901.0 | NaN | NaN | NaN | 1500 HAUSER BL | NaN | (34.0472, -118.3574) |
| 2013-01-02 20:00:00 | 132104178 | 2013-01-04 | 2013-01-02 | 20:00:00 | 21 | Topanga | 2158 | 341 | THEFT-GRAND ($950.01 & OVER)EXCPT,GUNS,FOWL,LI... | 0344 | ... | NaN | IC | Invest Cont | 341.0 | NaN | NaN | NaN | 6300 DE SOTO AV | NaN | (34.1847, -118.5888) |
| 2013-01-01 08:00:00 | 131505259 | 2013-01-24 | 2013-01-01 | 08:00:00 | 15 | N Hollywood | 1521 | 956 | LETTERS, LEWD | 1501 | ... | NaN | AO | Adult Other | 956.0 | NaN | NaN | NaN | 13100 VANOWEN ST | NaN | (34.194, -118.4181) |
6 rows × 26 columns
plt.subplots(figsize=(12, 4), dpi=200)

for sex in crimes["Victim Sex"].unique():
    ax = sns.distplot(
        crimes[crimes["Victim Sex"] == sex]["DateTime Occurred"].dt.hour,
        hist=False,
        label=sex)
    ax.legend()
plt.xlim(0, 23)
line, = ax.plot(a.mean(), 0)
/usr/local/lib/python3.6/site-packages/numpy/core/_methods.py:80: RuntimeWarning: invalid value encountered in double_scalars
ret = ret.dtype.type(ret / rcount)

Комментарии