Анализ геоданных на примере соревнования от Росбанка
Problem statement
Happy Data Year was data analysis championship from Rosbank held from November 22 to January 10.
Participants should have predicted the geolocation-based popularity index for placing an ATM.
The training sample contains adresses of six thousand ATMs of Rosbank and its partners, as well as the target variable - the ATM popularity index. In the test sample, there are another two and a half thousand ATMs, equally divided into public and private parts.
The main feature of this contest was that participants have to collect geodata by their own. Hence the success depended not so much from models as from feature engineering.
EDA
Lets look at the data first
import pickle
import math
from math import sin, cos, sqrt, atan2, radians
import time
import collections

import osmread
from tqdm import tqdm_notebook
import wget
from collections import Counter
import numpy as np
import pandas as pd
from scipy import stats

from sklearn.neighbors import NearestNeighbors
from sklearn.metrics import mean_squared_error, r2_score
from sklearn.model_selection import train_test_split
import xgboost

from sklearn.decomposition import PCA
from sklearn import preprocessing as pr

from scipy import stats

import lightgbm as lgb

from matplotlib import pyplot as plt
%matplotlib inline
%config InlineBackend.figure_format = 'svg'

SEED = 12
train = pd.read_csv('http://nagornyy.me/datasets/rosbank/train.csv', index_col=0)
test = pd.read_csv('http://nagornyy.me/datasets/rosbank/test.csv', index_col=0)
train['isTrain'] = True
test['isTrain'] = False

full = train.append(test, sort=False)
full.shape
As you can see there are not so many features in the dataset:
idis an unique indentifier of the ATM;atm_groupis the id of the bank ATM belongs to.addressis the only genuine featue which can tell us something about the location of the ATM;address_rusis the geocodedaddress, which was generated by organisers using Google Maps and Yandex Maps API.latandlong— latitude and longitude, genereted in the same way as the previous feature.target— popularity index.
full.target.hist();
Distribution of target is quite normal, may it needs one simple transformation.
Lets look at the spatial distribution of ATMs using Folium library.
import folium
import branca

fmap = folium.Map(location=[55.805827, 70.515146], max_zoom=7)
colorscale = branca.colormap.linear.RdBu_04.scale(full.target.min(), full.target.max())
for index, row in full[["lat", "long", "isTrain", "target"]].dropna(subset=["lat", "long"]).sample(frac=1).iterrows():
    if row.isTrain:
        folium.CircleMarker(location=[row["lat"], row["long"]],
                            radius=10,
                            opacity=1,
                            weight=3,
                            color=colorscale(row.target),
                            tooltip=f"Index:{index},\nTarget: {row.target}").add_to(fmap)
    else:
        folium.RegularPolygonMarker(location=[row["lat"], row["long"]],
                            radius=10,
                            fill_opacity=0,
                            opacity=0.7,
                            weight=3,
                            color="#999999",
                            number_of_sides=3,
                            tooltip=index).add_to(fmap)
fmap.save('../../../static/pages/rosbank.html')
The map shows us the coordinates of ATMs. Points from the test set have the shape of a circle and from the test set have a shaoe of triangle. Color of ATMs from the train set demonstrates its popularity index — blue circles are more popular than red.
The distribution of the points is quite natural. We don't see any congestion of the points from the test or train set on the map.
Baseline
Load all the data with the create_full_df function. Then extract the name of the city from the addresses and save it to the city column. Mark cities with less than 20 ATMs eith the name RARE, and then apply label encoding.
def create_full_df(city_label_enk=True):
    train = pd.read_csv('http://nagornyy.me/datasets/rosbank/train.csv', index_col=0)
    test = pd.read_csv('http://nagornyy.me/datasets/rosbank/test.csv', index_col=0)

    train['isTrain'] = True
    test['isTrain'] = False

    full = train.append(test, sort=False)

    full.id = full.id.astype("int")
    full.atm_group = full.atm_group.astype("category")

    counts = full.groupby('address_rus')['id'].count().reset_index().rename(columns={'id':'count'})
    full = pd.merge(full, counts, how='left', on='address_rus')

    full['city'] = full[~full.address_rus.isnull()].address_rus.apply(lambda x: x.split(',')[2])
    rare_cities = full.city.value_counts()[(full.city.value_counts() < 20) ==True].index
    if city_label_enk:
        full.city = full.city.apply(lambda x: 'RARE' if x in rare_cities else x)
        full.city = full.city.rank().astype("category")

    print("full_df created", time.ctime())
    return full
Implement Haversine Formula to calculate the distance between geographical points.
def distance(x,y):
    """
    Params
    ----------
    x : tuple, lat, long of the first point
    y : tuple, lat, long of the second point
    6373.0 : radius of the Earth

    Result
    ----------
    result : distanse between two points
    """
    lat_a, long_a, lat_b, long_b = map(radians, [*x,*y])
    dlon = long_b - long_a
    dlat = lat_b - lat_a
    a = sin(dlat/2)**2 + cos(lat_a) * cos(lat_b) * sin(dlon/2)**2
    c = 2 * atan2(sqrt(a), sqrt(1 - a))
    return 6373.0 * c
Then we define the function add_kneighbors_atmto calculate the distance between the nearest ATMs. The function takes a dataframe with the fields lat,long and adds to it the distance between each point and n_neighbors of other points closest to it, their indices, as well as the average distance to these points.
def add_kneighbors_atm(df, n_neighbors=7):
    df = df.copy()

    knc = NearestNeighbors(metric=distance)

    dots = df[['lat','long']].dropna()

    knc.fit(X=dots)

    distances, indexes = knc.kneighbors(X=dots, n_neighbors=n_neighbors)

    for i in range(1,6):
        dots['distance_%s'%i] = distances[:,i]
        dots['indexes_%s'%i] = indexes[:,i]
        dots['kurtosis_%s'%i] = stats.kurtosis(distances[:,i])
        dots['skew_%s'%i] = stats.skew(distances[:,i])
    dots['mean'] = dots.iloc[:,dots.columns.str.contains('distance')].mean(axis=1)

    df = pd.concat([df, dots.drop(columns=['lat', 'long'])], axis=1)
    print("neighbors added", time.ctime())
    return df
Define loss finction RMSE at last.
def rmse(y_true, y_pred):
    return sqrt(mean_squared_error(y_true, y_pred))
full = create_full_df()
full = add_kneighbors_atm(full)
neighbors added Fri Jan 18 13:45:25 2019
And get very preliminary results with LightGBM:
def simple_classifier(df):
    full = df.copy()
    full.isTrain = full.isTrain.fillna(False)
    col_drop = ['id', 'address', 'address_rus', 'target', 'isTrain'] + \
        [f'{n}_{i}' for i in range(1, 6) for n in ['indexes', 'kurtosis', 'skew']]

    X_ = full[full.isTrain].drop(columns=col_drop, errors='ignore')
    Y_ = full.loc[full.isTrain, 'target']

    X_train, X_valid, Y_train, Y_valid = train_test_split(
        X_, Y_, test_size=0.2, random_state=SEED
    )
    gbm = lgb.LGBMRegressor(objective = 'regression',
                                max_depth = 3,
                                colsample_bytre = 0.8,
                                subsample = 0.8,
                                learning_rate = 0.1,
                                n_estimators = 300,
                                random_state=SEED
                           )

    gbm.fit(X_train, Y_train, eval_set=[(X_valid, Y_valid)],
            eval_metric='rmse', early_stopping_rounds=5, verbose=False);

    print("RMSE: {rmse:.4}\nR^2: {r2:.3}".format(
        rmse=rmse(Y_valid, gbm.predict(X_valid)),
        r2=r2_score(Y_valid, gbm.predict(X_valid))
    ))
    return gbm

gbm = simple_classifier(full)
R^2: 0.726
Initially, we see a pretty good quality of predictions.
lgb.plot_importance(gbm);
The most important feature is the longitude, the second important featue is the city. Apparently, this is a consequence of the uneven development of the regions. In some cities, mainly in the west, ATMs are often used, in the east - less.
Adding features from Open Street Maps
One of the main parts of data analysis is the generation of features. If we have the coordinates of a point, we can recognize its environment, which almost always affects the performance of our model. Information about the environment can be gathered from the Open Street Maps. Russian maps in POIs can be downloaded at https://download.geofabrik.de/russia-latest.osm.pbf.
Lets investigate how far away from ATMs placed important objects that, at our opinion, will affect their popularity - metro stations, shops, etc. Something similar was done in the article “[How to predict the number of emergency calls in different parts of the city?] (https://habr.com/company/ru_mts/blog/353334/) ".
So, first we need to parse the source file with all the objects that are marked on the map of Russia. In the structure of the OSM file there are [three kinds of objects] (https://wiki.openstreetmap.org/wiki/Elements) - Node,Way and Relation. We are most likely to be interested in the objects of the first type - these are any points on the map from benches to cities. It is more difficult to count the distance from ATMs to the ways, and it’s not at all clear what to do with relationships.
Also, any type of object can have a property tags - this is a dictionary with very dofferent attributes — type, name, working hours, etc.
Let's select objects of type node, which are described by at least one attribute. Since the data file took several gigabytes, the filtering process took several hours.
def extract_osm_tags():
    # wget.download("https://download.geofabrik.de/russia-latest.osm.pbf")

    osm_file = osmread.parse_file('russia-latest.osm.pbf')

    tagged_nodes = [
        entry
        for entry in tqdm_notebook(osm_file)
        if isinstance(entry, osmread.Node)
        if len(entry.tags) > 0
    ]
    with open('tagged_nodes.pickle', 'wb') as fout:
        pickle.dump(tagged_nodes, fout, protocol=pickle.HIGHEST_PROTOCOL)
It turned out to find more than 4.6 million points that satisfy our conditions. We pickled them in a file for the fearther use.
with open('/datasets/rosbank/tagged_nodes.pickle.zip', 'rb') as fin:
    tagged_nodes = pickle.load(fin)
all_tags = [k for node in tagged_nodes for k in node.tags.keys()]
len(all_tags)
tags_counter = Counter(all_tags)
len(tags_counter)
We see enormous amount of unique tags — 9528332, and 4313 if unique tags. What is the distridution of the tags?
tags_counter.most_common(30)
('name', 849474),
('highway', 359997),
('amenity', 352595),
('source', 329248),
('entrance', 279908),
('created_by', 246999),
('shop', 246985),
('natural', 235112),
('barrier', 225253),
('ref', 209322),
('addr:housenumber', 193533),
('addr:street', 192234),
('place', 191271),
('addr:country', 132953),
('opening_hours', 124167),
('operator', 113489),
('railway', 104798),
('name:ru', 104460),
('crossing', 104392),
('addr:flats', 95497),
('addr:region', 95194),
('public_transport', 93675),
('addr:district', 88876),
('building', 87351),
('wikidata', 84128),
('wikipedia', 83524),
('addr:postcode', 81975),
('addr:city', 73604),
('name:en', 72904)]
Very uneven, as wee see. The difference detween the most prevalent tag and top-20 tag is large.
So in 4601457 objects we found 4313 unique tags, which is too much, especially considering their uneven distribution - even the third most popular tag is found in less than 10% of observations (most of all, by the way, electrical infrastructure ([power] (https://wiki.openstreetmap.org/wiki/Key:power)) - supports of electric transmission lines and everything related).
The dimension can be reduced by removing not very useful tags. For example, in many of the name of the object is written in different languages and in different styles: name,name: en, official_name, etc. We could to get rid of them, but lets make features that will show the amount of different names. Probably, these features will talk about the popularity of the object.
The same for tags starting with wikipedia is [links to Wikipedia articles in different languages] (https://wiki.openstreetmap.org/wiki/Key:wikipedia).
I did not decide do I need to remove the color tag, so leave it.
tagged_nodes_list = []
for node in tqdm_notebook(tagged_nodes):

    d = {k: v for k, v in  node.tags.items()
         if not
         (k.startswith("name:")
          or k.startswith("old_name")
          or k.startswith("alt_name")
          or k.startswith("wikipedia")
          #or k.startswith("color:")
          or k.startswith("official_name:")
         )
        }
    num_names = len([k for k in node.tags.keys() if k.startswith("name")])
    num_official_names = len([k for k in node.tags.keys() if k.startswith("official_name")])
    num_alt_names = len([k for k in node.tags.keys() if k.startswith("alt_name")])
    num_old_names = len([k for k in node.tags.keys() if k.startswith("old_name")])
    num_all_names = num_names + num_official_names + num_alt_names + num_old_names
    num_wiki = len([k for k in node.tags.keys() if k.startswith("wikipedia")])

    d.update({
        "lat": node.lat,
        "lon": node.lon,
        "id": node.id,
        "timestamp": node.timestamp,
        "num_names": num_names,
        "num_official_names": num_official_names,
        "num_alt_names": num_alt_names,
        "num_old_names": num_old_names,
        "num_all_names": num_all_names,
        "num_wiki": num_wiki
    })
    tagged_nodes_list.append(d)
The number of tags was redused from 4313 to 3755 (13% less):
c = Counter([tag for node in tagged_nodes_list for tag in node])
len(c)
And the tags that are found in more than 500 objects are only 337 (their total number, let me remind you, is more than 4.6 million):
frq_titles = [title for title, count in c.most_common() if count > 500]
len(frq_titles)
Now we can select all the tags to calculate 1) the distance between ATMs and N, where nearby points and 2) nummber of different points in a certain radius.
df_features = collections.OrderedDict([])

# Set of points we are interested in
POINT_FEATURE_FILTERS = [
    ('tagged', lambda
     node: len(node.tags) > 0),
    ('railway=station', lambda node: node.tags.get('railway') == 'station'),
] + [(i, lambda node: i in node.tags) for i in frq_titles if i is not 'id']


X_zone_centers = full[['lat', 'long']].dropna().values

for prefix, point_filter in tqdm_notebook(POINT_FEATURE_FILTERS, desc='Фильтр'):

    coords = np.array([
        [node.lat, node.lon]
        for node in tagged_nodes
        if point_filter(node)
    ])


    neighbors = NearestNeighbors().fit(coords)

    # feature "number of points in radius R"
    for radius in [0.001, 0.003, 0.005, 0.007, 0.01]:
        dists, inds = neighbors.radius_neighbors(X=X_zone_centers, radius=radius)
        df_features['{}_points_in_{}'.format(prefix, radius)] = \
            np.array([len(x) for x in inds])

    # feature "distance to the nearest K points"
    for n_neighbors in [1, 3, 5, 10]:
        dists, inds = neighbors.kneighbors(X=X_zone_centers, n_neighbors=n_neighbors)
        df_features['{}_mean_dist_k_{}'.format(prefix, n_neighbors)] = \
            dists.mean(axis=1)
        df_features['{}_max_dist_k_{}'.format(prefix, n_neighbors)] = \
            dists.max(axis=1)
        df_features['{}_std_dist_k_{}'.format(prefix, n_neighbors)] = \
            dists.std(axis=1)

    # featue "distance to the any nearest point"
    df_features['{}_min'.format(prefix)] = dists.min(axis=1)

# save new data
df_features = pd.DataFrame(df_features, index=full[['lat', 'long']].dropna().index)
df_features.to_csv('/datasets/rosbank/features_500.csv.zip', compression='zip')
df_features = pd.read_csv('../../../static/datasets/rosbank/features_500.csv.zip', compression='zip', index_col=0)
df_features.head()
| tagged_points_in_0.001 | tagged_points_in_0.003 | tagged_points_in_0.005 | tagged_points_in_0.007 | tagged_points_in_0.01 | tagged_mean_dist_k_1 | tagged_max_dist_k_1 | tagged_std_dist_k_1 | tagged_mean_dist_k_3 | tagged_max_dist_k_3 | ... | ruins_mean_dist_k_3 | ruins_max_dist_k_3 | ruins_std_dist_k_3 | ruins_mean_dist_k_5 | ruins_max_dist_k_5 | ruins_std_dist_k_5 | ruins_mean_dist_k_10 | ruins_max_dist_k_10 | ruins_std_dist_k_10 | ruins_min | |
|---|---|---|---|---|---|---|---|---|---|---|---|---|---|---|---|---|---|---|---|---|---|
| id | |||||||||||||||||||||
| 8526 | 0 | 1 | 9 | 54 | 127 | 0.002476 | 0.002476 | 0.0 | 0.003067 | 0.003431 | ... | 5.291163 | 5.291224 | 0.000050 | 5.291307 | 5.291765 | 0.000237 | 5.291705 | 5.292427 | 0.000463 | 5.291101 |
| 8532 | 4 | 16 | 36 | 64 | 127 | 0.000393 | 0.000393 | 0.0 | 0.000615 | 0.000731 | ... | 5.275803 | 5.275864 | 0.000050 | 5.275947 | 5.276405 | 0.000237 | 5.276346 | 5.277068 | 0.000463 | 5.275742 |
| 8533 | 11 | 133 | 272 | 447 | 843 | 0.000348 | 0.000348 | 0.0 | 0.000372 | 0.000395 | ... | 5.294956 | 5.295017 | 0.000050 | 5.295101 | 5.295560 | 0.000237 | 5.295501 | 5.296225 | 0.000465 | 5.294894 |
| 8684 | 79 | 467 | 955 | 1409 | 2054 | 0.000052 | 0.000052 | 0.0 | 0.000183 | 0.000260 | ... | 0.352660 | 0.495956 | 0.175553 | 0.446310 | 0.589103 | 0.177902 | 0.682405 | 1.099252 | 0.282489 | 0.105433 |
| 37 | 8 | 69 | 141 | 218 | 286 | 0.000168 | 0.000168 | 0.0 | 0.000339 | 0.000513 | ... | 15.634626 | 18.100765 | 1.757582 | 18.533833 | 25.578784 | 4.167641 | 24.116806 | 31.336085 | 6.483454 | 14.132749 |
5 rows × 6084 columns
So, we generated a bunch of features showing the distance between ATMs, from ATMs to all possible points from among the top 500, and the number of these points in different radii. It turned out 6087 features, most of which, of course, are irrelevant. What is next? Of course ...
Feature Selection
For further work, it is necessary to select the most important features, for example, 300 of them. Let us turn to the methods of feature extraction called Wrapper methods with the random forest model. I wrote about feature selection methods in the article Feature engineering.
mega_full = pd.concat([full.set_index("id"), df_features], sort=False, axis=1)
col_drop = ['address', 'address_rus', 'target', 'isTrain']
def select_features(df):
    from sklearn.ensemble import RandomForestRegressor
    from sklearn.feature_selection import RFE

    X = df.query('isTrain == True').drop(columns=col_drop)
    y = df.query('isTrain == True')['target']

    rfr = RandomForestRegressor(n_jobs=4, random_state=SEED, n_estimators=10, verbose=0)
    rfr_selector = RFE(rfr, n_features_to_select=10, step=10, verbose=0)
    rfr_selector = rfr_selector.fit(X, y)

    features_ranks = {i: X.columns[rfr_selector.ranking_ <= i] for i in set(rfr_selector.ranking_)}

    # download at http://nagornyy.me/datasets/rosbank/features_ranks.pickle.zip
    pickle.dump(features_ranks, open("../../../static/datasets/rosbank/features_ranks.pickle", "wb"))

    return features_ranks
best_features = pickle.load(open('../../../static/datasets/rosbank/features_ranks.pickle', 'rb'))
Here we see the names of the top-45 features.
for tier in list(best_features)[:10]:
    print(tier, len(best_features[tier]))

print(' 💥 '.join(best_features[5]))
2 15
3 25
4 35
5 45
6 55
7 65
8 75
9 85
10 95
atm_group 💥 lat 💥 long 💥 count 💥 distance_1 💥 distance_2 💥 distance_3 💥 distance_4 💥 distance_5 💥 mean 💥 tagged_points_in_0.003 💥 tagged_points_in_0.005 💥 tagged_points_in_0.007 💥 tagged_points_in_0.01 💥 tagged_mean_dist_k_1 💥 tagged_max_dist_k_1 💥 tagged_mean_dist_k_3 💥 tagged_max_dist_k_3 💥 tagged_std_dist_k_3 💥 tagged_std_dist_k_5 💥 tagged_max_dist_k_10 💥 tagged_std_dist_k_10 💥 railway=station_max_dist_k_1 💥 railway=station_mean_dist_k_3 💥 railway=station_max_dist_k_3 💥 railway=station_std_dist_k_3 💥 railway=station_mean_dist_k_5 💥 railway=station_max_dist_k_5 💥 railway=station_std_dist_k_5 💥 railway=station_mean_dist_k_10 💥 railway=station_max_dist_k_10 💥 railway=station_std_dist_k_10 💥 ref_max_dist_k_5 💥 addr:street_std_dist_k_5 💥 bicycle_max_dist_k_3 💥 contact:vk_mean_dist_k_5 💥 covered_min 💥 start_date_std_dist_k_10 💥 payment:mastercard_std_dist_k_3 💥 bic_mean_dist_k_10 💥 post_box:type_max_dist_k_10 💥 surveillance:zone_max_dist_k_10 💥 abandoned_max_dist_k_5 💥 maxheight_std_dist_k_5 💥 ruins_mean_dist_k_1
mega_full.atm_group = mega_full.atm_group.astype("category")#cat.add_categories(-1).fillna(-1)
mega_full.city = mega_full.city.astype("category")#cat.add_categories(-1).fillna(-1)

lgb.plot_importance(
    simple_classifier(mega_full[best_features[4].tolist() + ['target', 'isTrain']]),
    figsize=(7, 9)
);
R^2: 0.729
Самостоятельное задание
Я собрал базу банкоматов с banki.ru, чтобы улучшить результаты классификатора. К сожалению, я не успел применить их в модели. Ваша задача — закончить построение классификатора используюя эти данные.
Далее идёт часть ноутбука с кодом загрузки данных и ссылкой на скачивания готового файла.
База банкоматов, которую выдали организаторы, очевидно неполная. Здравый смысл подсказывает, что в стране установлено намного больше ≈9000 банкоматов. Скорее, это число исчисляется стонями тысяч. Следовательно, один из путей повышения качества классификатора — расширение базы данных.
Также хорошо было бы увеличить количество информации о каждом банкомате. Если мы хотим выявить предикторы популярности, то, кажется, одинм из самых важных из них будет график работы. Однако это информации нет ни в исходных данных, ни в OSM.
Но где достать наиболее полную базу банкоматов России? Тут на помощь приходит сайт banki.ru, где, помимо всего прочего собрана огромная база отделений банков и банкоматов. Кстати говоря, очень рекомендую это сайт — так куча полезных статей, информации о вкладах, кретитных тарифах и т.п.
Итак, нам необходимо собрать этот набора данных сайта. О веб-скраппинге и парсинге я подробно писал в соответсвующей статье.
Загрузка данных будет происходить в три этапа:
- Загрузка списка городов.
- Загрузка списка банкоматов из каждого города.
- Загрузка расширенной информации о каждом банкомате. Тут нас больше всего будет интересовать время его работы.
Загрузка списка городов
К счастью, города можно загрузить в формате JSON по прямому URL.
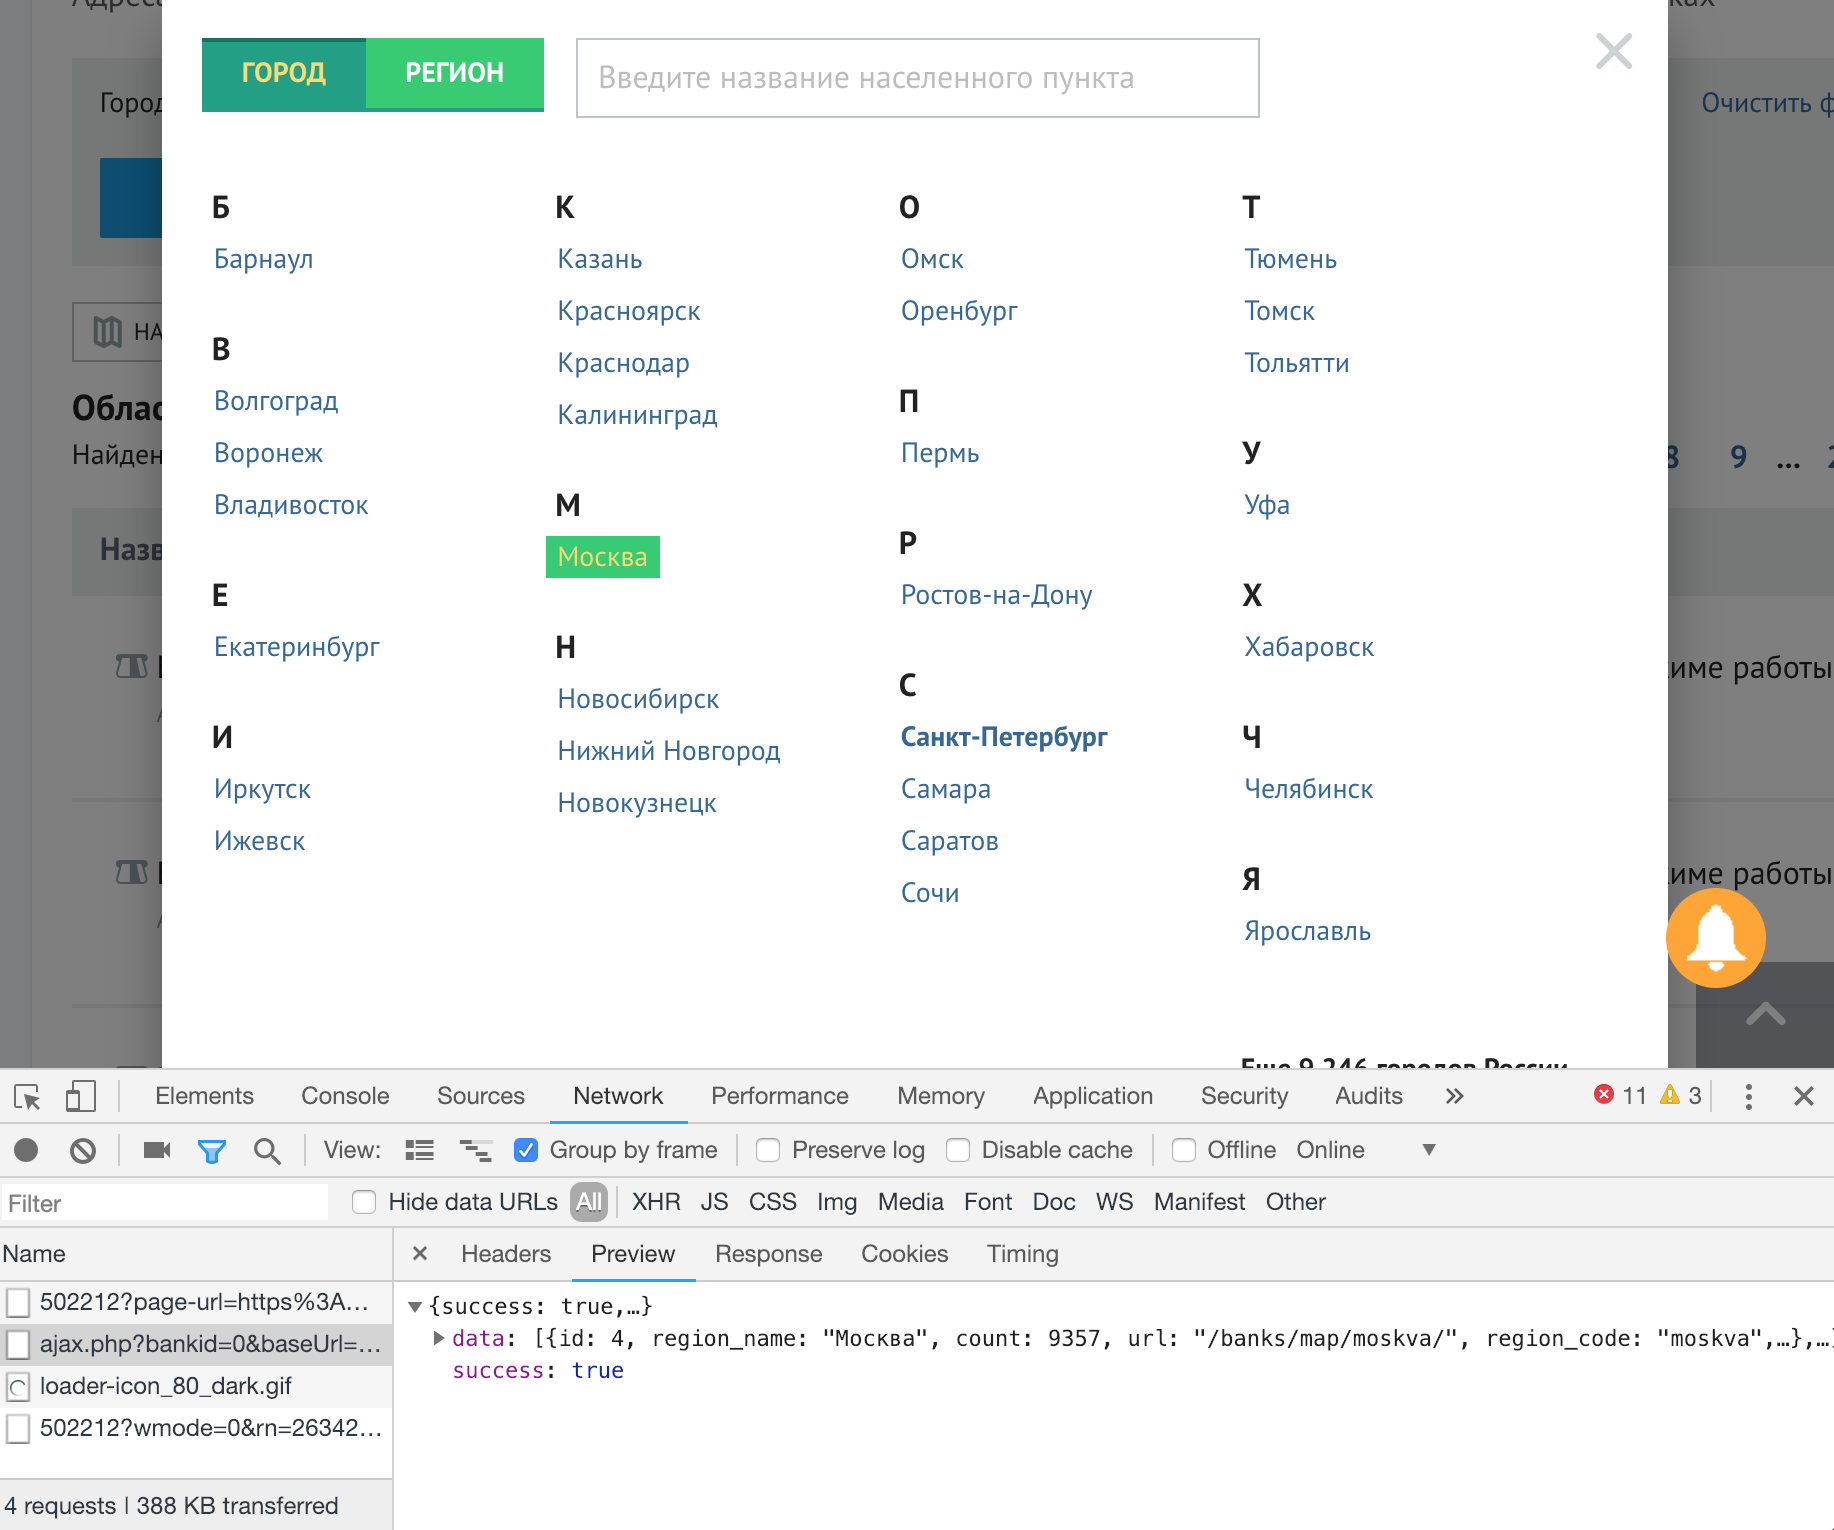
Всего в базе 9276 городов. Ожидаемо, больше всего банкоматов в Москве, затем идут Санкт-Петербург и Новосибирск.
import requests
import pandas as pd
import json
from tqdm import tqdm_notebook
import time
import pickle
import math
url_cities = ('https://www.banki.ru/bitrix/components/banks/universal.select.region/ajax.php' +
    '?bankid=0&baseUrl=%2Fbanks%2Fmap%2F&appendUrl=&type=city')
res_cities = requests.get(url_cities)
sorted(res_cities.json()['data'], key=lambda x: x['count'], reverse=True)[:3]
'region_name': 'Москва',
'count': 9357,
'url': '/banks/map/moskva/',
'region_code': 'moskva',
'region_id': 4,
'region_name_full': 'Москва',
'kladr_code': '7700000000000'},
{'id': 211,
'region_name': 'Санкт-Петербург',
'count': 4689,
'url': '/banks/map/sankt-peterburg/',
'region_code': 'sankt-peterburg',
'region_id': 211,
'region_name_full': 'Санкт-Петербург',
'kladr_code': '7800000000000'},
{'id': 677,
'region_name': 'Новосибирск',
'count': 1841,
'url': '/banks/map/novosibirsk/',
'region_code': 'novosibirsk',
'region_id': 677,
'region_name_full': 'Новосибирск',
'kladr_code': '5400000100000'}]
Загрузка списка банкоматов из каждого города
Для загрузки банкоматов из города необходимо делать POST-запросы с определёнными заголовками на адрес https://www.banki.ru/api/. Заголовки можно скопировать из Chrome Developer Tools в формате cURL. Тут я хочу пожелать здоровья человеку, который сдел сервис для перевода формата cURL в пригодный для использования Питоновским моделуем requests.
NB: если запросы будут выполняться слишком часто, сайт попросит вести каптчу, что нам совершенно не нужно. Чтобы избежать этого, добавим пазузу в 0.3 секунды между запросами.
headers = {
    'cookie': 'PHPSESSID=93bfdc45fd9cc9a8a8a3d50c2447639e; BANKI_RU_USER_IDENTITY_UID=5549793729193099991; aff_sub3=main; uid=uQo9b1wiJOM7IVHaBCLlAg==; __utmc=241422353; _ga=GA1.2.199415927.1545741541; _ym_uid=1545741541860272573; _ym_d=1545741541; ga_client_id=199415927.1545741541; scs=%7B%22t%22%3A1%7D; flocktory-uuid=721c443d-8411-4607-8c77-9eaa3490ad79-2; sbjs_migrations=1418474375998%3D1; sbjs_first_add=fd%3D2018-12-25%2015%3A39%3A03%7C%7C%7Cep%3Dhttps%3A%2F%2Fwww.banki.ru%2F%7C%7C%7Crf%3Dhttps%3A%2F%2Fwww.google.com%2F; sbjs_first=typ%3Dorganic%7C%7C%7Csrc%3Dgoogle%7C%7C%7Cmdm%3Dorganic%7C%7C%7Ccmp%3D%28none%29%7C%7C%7Ccnt%3D%28none%29%7C%7C%7Ctrm%3D%28none%29; ins-mig-done=1; lp_vid=c522904b-b4ae-467f-5a09-f28119eb8f57; spUID=1545741543376ba14961ee0.919b1d92; __io_lv=1545741551218; __io_uid_test=8; __io=5e24aa2a9.d4efafdc0_1545741551223; _io_un=; _io_un=; _io_un=25; __utmv=241422353.|1=siteDesign=new=1; lp_abtests=[{"SessionId":"300285","WidgetId":4568,"TestId":37}]; views_counter=%7B%22news%22%3A%5B10802672%5D%7D; _gid=GA1.2.1726664245.1546467651; __utmz=241422353.1546467651.2.2.utmcsr=google|utmccn=(organic)|utmcmd=organic|utmctr=(not%20provided); _ym_isad=1; BANKI_RU_GUEST_ID=606957941; user-region-id=1; _fbp=fb.1.1546526535416.1197015680; decid_cache=1261000702; decid_png=1261000702; decid_etag=1261000702; DEC_ID=1261000702; BANKI_RU_DLDB=1265655189; __utma=241422353.199415927.1545741541.1546533080.1546536112.6; __utmt=1; _ic_c=6..google_organic; sbjs_current_add=fd%3D2019-01-03%2020%3A21%3A52%7C%7C%7Cep%3Dhttps%3A%2F%2Fwww.banki.ru%2Fbanks%2Fmap%2Fbarnaul%2F%23%2F%21b1%3Aall%21s3%3Abankomaty%21s4%3Alist%21m4%3A1%21p1%3A1%7C%7C%7Crf%3Dhttps%3A%2F%2Fwww.banki.ru%2Fbanks%2Fmap%2Fbarnaul%2F; sbjs_current=typ%3Dreferral%7C%7C%7Csrc%3Dbanki.ru%7C%7C%7Cmdm%3Dreferral%7C%7C%7Ccmp%3D%28none%29%7C%7C%7Ccnt%3D%2Fbanks%2Fmap%2Fbarnaul%2F%7C%7C%7Ctrm%3D%28none%29; sbjs_udata=vst%3D6%7C%7C%7Cuip%3D%28none%29%7C%7C%7Cuag%3DMozilla%2F5.0%20%28Macintosh%3B%20Intel%20Mac%20OS%20X%2010_14_2%29%20AppleWebKit%2F537.36%20%28KHTML%2C%20like%20Gecko%29%20Chrome%2F71.0.3578.98%20Safari%2F537.36; ins-gaSSId=a8a876f6-e72b-5ea9-6348-60de0df03b4b_1546536114; lp_session=247585; _ym_visorc_502212=b; NonRobot=15465365840c4f6fe5021cfba98ee584c8ed0c080b729+acfc037aae7e3cd2095d5a5c38fcbc1d; __utmb=241422353.5.10.1546536112; _gat=1; _gat_bankiru_test=1; sbjs_session=pgs%3D5%7C%7C%7Ccpg%3Dhttps%3A%2F%2Fwww.banki.ru%2Fbanks%2Fmap%2Fbarnaul%2F%3F%23%2F%21b1%3Aall%21s3%3Abankomaty%21s4%3Alist%21m1%3A12%21m2%3A53.356132%21m3%3A83.74962%21p1%3A1; tmr_detect=1%7C1546536586502; BANKI_RU_LAST_VISIT=03.01.2019+20%3A29%3A46; BANKI_RU_BANNERS=452_20055_1_04012019%2C452_10427_1_04012019%2C106_10808_1_04012019%2C106_797_15_04012019%2C106_809_11_04012019; insdrSV=32; lp_pageview=5; _gat_UA-38591118-1=1; bank_geo_link=#/!b1:all!s3:bankomaty!s4:list!m1:12!m2:53.356132!m3:83.74962!p1:1',
    'origin': 'https://www.banki.ru',
    'accept-encoding': 'gzip, deflate, br',
    'accept-language': 'en-GB,en-US;q=0.9,en;q=0.8,ru;q=0.7',
    'user-agent': 'Mozilla/5.0 (Macintosh; Intel Mac OS X 10_14_2) AppleWebKit/537.36 (KHTML, like Gecko) Chrome/71.0.3578.98 Safari/537.36',
    'content-type': 'application/x-www-form-urlencoded; charset=UTF-8',
    'accept': 'application/json, text/javascript, */*; q=0.01',
    'referer': 'https://www.banki.ru/banks/map/barnaul/?',
    'authority': 'www.banki.ru',
    'x-requested-with': 'XMLHttpRequest',
    'save-data': 'on',
}


data = {
    "jsonrpc":"2.0",
    "method":"bankGeo/getObjectsByFilter",
    "params":{
        "with_empty_coordinates":True,
        "limit":10000,
        "type":["atm","self_office"],
        "region_id":[]
    },
    "id":"2"
}
atms_all = []

for city in tqdm_notebook(res_cities.json()['data']):
    data['params']['region_id'] = [city['region_id']]
    response_atms_city = requests.post('https://www.banki.ru/api/', headers=headers, data=json.dumps(data))
    time.sleep(0.3) # иначе просят ввести каптчу
    atms_city = response_atms_city.json()['result']['data'].copy()
    for atm in atms_city:
        atm.update({
            "region": city["region_name"]
        })
        atms_all.append(atm)
Неплохой услов! Мы собрали информацию о 86021 банкомате за полтора часа, что гораздо больше, чем дали нам организаторы.
atms_all_df = pd.DataFrame(atms_all)
atms_all_df.head()
| active | address | bank_id | icon_url | id | is_main | latitude | longitude | name | region | region_id | sort | type | |
|---|---|---|---|---|---|---|---|---|---|---|---|---|---|
| 0 | True | г. Москва, пер. Малый Сухаревский, д. 7 | 9259 | /upload/iblock/a0d/9259.gif | 6588499 | True | 55.770445 | 37.623941 | Банкомат | Москва | 4 | 5 | atm |
| 1 | True | г. Москва, просп. Кутузовский, д. 24 | 9259 | /upload/iblock/a0d/9259.gif | 6572679 | True | 55.744597 | 37.545693 | Банкомат | Москва | 4 | 5 | atm |
| 2 | True | г. Москва, ул. Малая Дмитровка, д. 10 | 9259 | /upload/iblock/a0d/9259.gif | 7122179 | True | 55.768714 | 37.606467 | Банкомат | Москва | 4 | 5 | atm |
| 3 | True | г. Москва, ул. Садовая-Черногрязская, д. 3 Б, ... | 9259 | /upload/iblock/a0d/9259.gif | 8493289 | True | 55.767398 | 37.652819 | Банкомат | Москва | 4 | 5 | atm |
| 4 | True | г. Москва, ул. Бакунинская, д. 23/41 | 9259 | /upload/iblock/a0d/9259.gif | 6602441 | True | 55.775659 | 37.683584 | Банкомат | Москва | 4 | 5 | atm |
Загрузка расширенной информации о каждом банкомате
Здесь почти всё так же, как и в предыдущем шаге, только посылаем немного другие данные — в params > id_list нужно поместить список id нужных нам банкоматов. Если список будет слишком большой, получится ошибка, поэтому разобьем ранее собранный список банкоматов на пакеты по 500 штук, а затем будем запрашивать информацию о каждом пакете по очереди.
headers = {
    'cookie': 'PHPSESSID=93bfdc45fd9cc9a8a8a3d50c2447639e; BANKI_RU_USER_IDENTITY_UID=5549793729193099991; aff_sub3=main; uid=uQo9b1wiJOM7IVHaBCLlAg==; __utmc=241422353; _ga=GA1.2.199415927.1545741541; _ym_uid=1545741541860272573; _ym_d=1545741541; ga_client_id=199415927.1545741541; scs=%7B%22t%22%3A1%7D; flocktory-uuid=721c443d-8411-4607-8c77-9eaa3490ad79-2; sbjs_migrations=1418474375998%3D1; sbjs_first_add=fd%3D2018-12-25%2015%3A39%3A03%7C%7C%7Cep%3Dhttps%3A%2F%2Fwww.banki.ru%2F%7C%7C%7Crf%3Dhttps%3A%2F%2Fwww.google.com%2F; sbjs_first=typ%3Dorganic%7C%7C%7Csrc%3Dgoogle%7C%7C%7Cmdm%3Dorganic%7C%7C%7Ccmp%3D%28none%29%7C%7C%7Ccnt%3D%28none%29%7C%7C%7Ctrm%3D%28none%29; ins-mig-done=1; lp_vid=c522904b-b4ae-467f-5a09-f28119eb8f57; spUID=1545741543376ba14961ee0.919b1d92; __io_lv=1545741551218; __io_uid_test=8; __io=5e24aa2a9.d4efafdc0_1545741551223; _io_un=; _io_un=; _io_un=25; __utmv=241422353.|1=siteDesign=new=1; lp_abtests=[{"SessionId":"300285","WidgetId":4568,"TestId":37}]; views_counter=%7B%22news%22%3A%5B10802672%5D%7D; _gid=GA1.2.1726664245.1546467651; __utmz=241422353.1546467651.2.2.utmcsr=google|utmccn=(organic)|utmcmd=organic|utmctr=(not%20provided); BANKI_RU_GUEST_ID=606957941; user-region-id=1; _fbp=fb.1.1546526535416.1197015680; decid_cache=1261000702; decid_png=1261000702; decid_etag=1261000702; DEC_ID=1261000702; BANKI_RU_DLDB=1265655189; sbjs_current=typ%3Dreferral%7C%7C%7Csrc%3Dbanki.ru%7C%7C%7Cmdm%3Dreferral%7C%7C%7Ccmp%3D%28none%29%7C%7C%7Ccnt%3D%2Fbanks%2Fmap%2Fbarnaul%2F%7C%7C%7Ctrm%3D%28none%29; NonRobot=15465365840c4f6fe5021cfba98ee584c8ed0c080b729+acfc037aae7e3cd2095d5a5c38fcbc1d; __utma=241422353.199415927.1545741541.1546536112.1546536737.7; _ic_c=7..google_organic; sbjs_current_add=fd%3D2019-01-03%2021%3A28%3A04%7C%7C%7Cep%3Dhttps%3A%2F%2Fwww.banki.ru%2Fbanks%2Fmap%2Fmoskva%2F%7C%7C%7Crf%3Dhttps%3A%2F%2Fwww.banki.ru%2Fbanks%2Fmap%2Fbarnaul%2F%3F; sbjs_udata=vst%3D7%7C%7C%7Cuip%3D%28none%29%7C%7C%7Cuag%3DMozilla%2F5.0%20%28Macintosh%3B%20Intel%20Mac%20OS%20X%2010_14_2%29%20AppleWebKit%2F537.36%20%28KHTML%2C%20like%20Gecko%29%20Chrome%2F71.0.3578.98%20Safari%2F537.36; _ym_isad=1; ins-gaSSId=1b8edf15-7c15-36e1-ee0e-84d01dea36eb_1546540085; lp_session=271976; __utmt=1; __utmb=241422353.5.9.1546540079434; _gat=1; tmr_detect=1%7C1546543574331; _gat_bankiru_test=1; _ym_visorc_502212=b; BANKI_RU_LAST_VISIT=03.01.2019+22%3A26%3A14; insdrSV=38; BANKI_RU_BANNERS=452_20055_1_04012019%2C452_10427_1_04012019%2C106_10808_1_04012019%2C106_797_17_04012019%2C106_809_15_04012019; sbjs_session=pgs%3D4%7C%7C%7Ccpg%3Dhttps%3A%2F%2Fwww.banki.ru%2Fbanks%2Fmap%2Fmoskva%2F%23%2F%21b1%3Aall%21s3%3Abankomaty%21s4%3Alist%21m1%3A10%21m2%3A55.755773%21m3%3A37.617761%21p1%3A1; lp_pageview=3; bank_geo_link=#/!b1:all!s3:bankomaty!s4:list!m1:10!m2:55.755773!m3:37.617761!p1:2',
    'origin': 'https://www.banki.ru',
    'accept-encoding': 'gzip, deflate, br',
    'accept-language': 'en-GB,en-US;q=0.9,en;q=0.8,ru;q=0.7',
    'user-agent': 'Mozilla/5.0 (Macintosh; Intel Mac OS X 10_14_2) AppleWebKit/537.36 (KHTML, like Gecko) Chrome/71.0.3578.98 Safari/537.36',
    'content-type': 'application/x-www-form-urlencoded; charset=UTF-8',
    'accept': 'application/json, text/javascript, */*; q=0.01',
    'referer': 'https://www.banki.ru/banks/map/moskva/',
    'authority': 'www.banki.ru',
    'x-requested-with': 'XMLHttpRequest',
    'save-data': 'on',
}

data = {
    "jsonrpc":"2.0",
    "method":"bank/getBankObjectsData",
    "params":{
        "id_list": []
    },
    "id":"6"
}

#response = requests.post('https://www.banki.ru/api/', headers=headers, data=json.dumps(data))
num_batches = math.ceil(len(atms_all)/500)

allAtms_fullInfo = []

for batch in tqdm_notebook(range(0, num_batches)):
    data['params']['id_list'] = [atm['id'] for atm in atms_all[batch * 500: (batch + 1) * 500]]
    response = requests.post('https://www.banki.ru/api/', headers=headers, data=json.dumps(data))
    time.sleep(.3)
    try:
        allAtms_fullInfo.extend(response.json()['result']['data'])
    except KeyError as err:
        print(err, response.json())

pickle.dump(allAtms_fullInfo, open('output/banki.ru_atms_fullInfo.pickle', 'wb'))
len(allAtms_fullInfo)
atms_allInfo_df = pd.DataFrame(allAtms_fullInfo)
atms_allInfo_df.head()
| active | additional | address | bank_code | bank_icon_url | bank_id | bank_logo2_url | bank_logo_url | bank_name | bank_site | ... | metro_name | name | phone | region_id | schedule_entities | schedule_general | schedule_private_person | schedule_vip | type | without_weekend | |
|---|---|---|---|---|---|---|---|---|---|---|---|---|---|---|---|---|---|---|---|---|---|
| 0 | 1 | Валюта: рубли | г. Москва, пер. Малый Сухаревский, д. 7 | absolutbank | /upload/iblock/a0d/9259.gif | 9259 | https://www.banki.ru/upload/iblock/3d8/absolut... | https://www.banki.ru/upload/iblock/f71/absolut... | Абсолют Банк | www.absolutbank.ru | ... | Цветной бульвар, Сухаревская, Трубная | Банкомат | 4 | atm | 0 | |||||
| 1 | 1 | С функцией приема наличных.<br />\nВалюта: руб... | г. Москва, просп. Кутузовский, д. 24 | absolutbank | /upload/iblock/a0d/9259.gif | 9259 | https://www.banki.ru/upload/iblock/3d8/absolut... | https://www.banki.ru/upload/iblock/f71/absolut... | Абсолют Банк | www.absolutbank.ru | ... | Выставочная, Кутузовская, Деловой центр | Банкомат | 4 | atm | 1 | |||||
| 2 | 1 | С функцией приема наличных.<br />\nВалюта: рубли. | г. Москва, ул. Малая Дмитровка, д. 10 | absolutbank | /upload/iblock/a0d/9259.gif | 9259 | https://www.banki.ru/upload/iblock/3d8/absolut... | https://www.banki.ru/upload/iblock/f71/absolut... | Абсолют Банк | www.absolutbank.ru | ... | Чеховская, Пушкинская, Тверская | Банкомат | 4 | atm | 1 | |||||
| 3 | 1 | С функцией приема наличных.<br />\nВалюта: руб... | г. Москва, ул. Садовая-Черногрязская, д. 3 Б, ... | absolutbank | /upload/iblock/a0d/9259.gif | 9259 | https://www.banki.ru/upload/iblock/3d8/absolut... | https://www.banki.ru/upload/iblock/f71/absolut... | Абсолют Банк | www.absolutbank.ru | ... | Красные Ворота, Комсомольская | Банкомат | 4 | atm | 1 | |||||
| 4 | 1 | С функцией приема наличных.<br />\nВалюта: руб... | г. Москва, ул. Бакунинская, д. 23/41 | absolutbank | /upload/iblock/a0d/9259.gif | 9259 | https://www.banki.ru/upload/iblock/3d8/absolut... | https://www.banki.ru/upload/iblock/f71/absolut... | Абсолют Банк | www.absolutbank.ru | ... | Бауманская | Банкомат | 4 | atm | 1 |
5 rows × 28 columns
atms_allInfo_df.isna().sum()
additional 0
address 0
bank_code 0
bank_icon_url 1912
bank_id 0
bank_logo2_url 0
bank_logo_url 0
bank_name 0
bank_site 0
comment_to_address 0
id 0
is_at_closed_place 0
is_main_office 0
is_round_the_clock 0
is_works_as_shop 0
latitude 14
longitude 14
metro_name 0
name 0
phone 0
region_id 0
schedule_entities 0
schedule_general 0
schedule_private_person 0
schedule_vip 0
type 0
without_weekend 0
accept_cash 0
dtype: int64
atms_allInfo_df.columns
'bank_id', 'bank_logo2_url', 'bank_logo_url', 'bank_name', 'bank_site',
'comment_to_address', 'id', 'is_at_closed_place', 'is_main_office',
'is_round_the_clock', 'is_works_as_shop', 'latitude', 'longitude',
'metro_name', 'name', 'phone', 'region_id', 'schedule_entities',
'schedule_general', 'schedule_private_person', 'schedule_vip', 'type',
'without_weekend', 'accept_cash'],
dtype='object')
atms_allInfo_df["accept_cash"] = atms_allInfo_df.additional.str.contains("приёма наличных")
atms_allInfo_df["accept_cash"].value_counts()
True 345
Name: accept_cash, dtype: int64
atms_allInfo_df.is_at_closed_place.value_counts()
True 1417
Name: is_at_closed_place, dtype: int64
atms_allInfo_df.is_at_closed_place.value_counts()
True 1417
Name: is_at_closed_place, dtype: int64
atms_allInfo_df.is_main_office.value_counts()
1 2
Name: is_main_office, dtype: int64
atms_allInfo_df.is_round_the_clock.value_counts()
True 27456
Name: is_round_the_clock, dtype: int64
atms_allInfo_df.is_works_as_shop.value_counts()
False 27754
Name: is_works_as_shop, dtype: int64
list(set(atms_all_df.columns) & set(atms_allInfo_df.columns))
'latitude',
'longitude',
'active',
'type',
'address',
'bank_id',
'region_id',
'name']
atms_all_df.dtypes
address object
bank_id int64
icon_url object
id int64
is_main bool
latitude float64
longitude float64
name object
region object
region_id int64
sort int64
type object
dtype: object
atms_allInfo_df.dtypes
additional object
address object
bank_code object
bank_icon_url object
bank_id int64
bank_logo2_url object
bank_logo_url object
bank_name object
bank_site object
comment_to_address object
id int64
is_at_closed_place bool
is_main_office int64
is_round_the_clock bool
is_works_as_shop bool
latitude object
longitude object
metro_name object
name object
phone object
region_id object
schedule_entities object
schedule_general object
schedule_private_person object
schedule_vip object
type object
without_weekend int64
dtype: object
atms_allInfo_df[["latitude", "longitude", 'region_id']] = atms_allInfo_df[["latitude", "longitude", 'region_id']].apply(pd.to_numeric)
atms_allInfo_df.active = atms_allInfo_df.active.astype(bool)
atms_allInfo_df[["latitude", "longitude"]] = atms_allInfo_df[["latitude", "longitude"]].round(7)
atms_all_df[["latitude", "longitude"]] = atms_all_df[["latitude", "longitude"]].round(7)
atms_full_df = pd.merge(
    atms_all_df,
    atms_allInfo_df,
    on=['id', "latitude", "longitude"],
    how="outer",
)
atms_full_df.shape, atms_all_df.shape, atms_allInfo_df.shape
atms_full_df.columns
'latitude', 'longitude', 'name_x', 'region', 'region_id_x', 'sort',
'type_x', 'active_y', 'additional', 'address_y', 'bank_code',
'bank_icon_url', 'bank_id_y', 'bank_logo2_url', 'bank_logo_url',
'bank_name', 'bank_site', 'comment_to_address', 'is_at_closed_place',
'is_main_office', 'is_round_the_clock', 'is_works_as_shop',
'metro_name', 'name_y', 'phone', 'region_id_y', 'schedule_entities',
'schedule_general', 'schedule_private_person', 'schedule_vip', 'type_y',
'without_weekend'],
dtype='object')
Комментарии